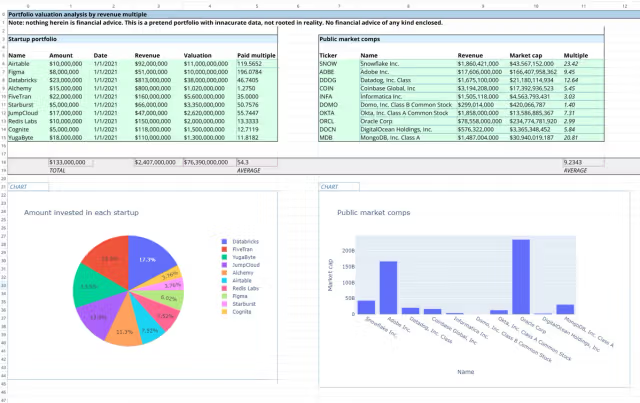
Startup portfolio
Track a sample venture portfolio using Python and Formulas.
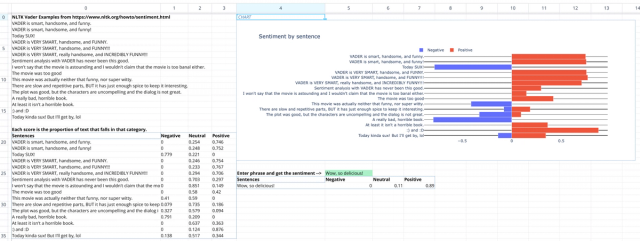
Sentiment analysis
Get the sentiment of phrases in your spreadsheet from text data using NLTK.
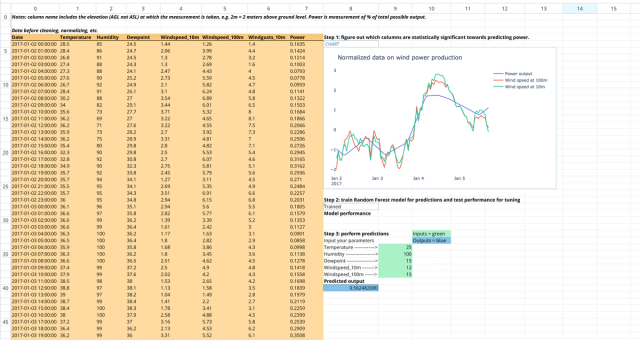
Machine learning tutorial
Build your first scikit-learn example using renewable energy data from a wind farm.
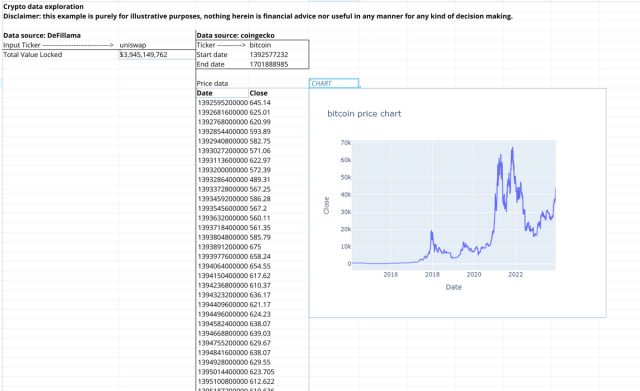
Crypto data exploration
Explore crypto assets in your spreadsheet using data from Coingecko and DeFiLlama.
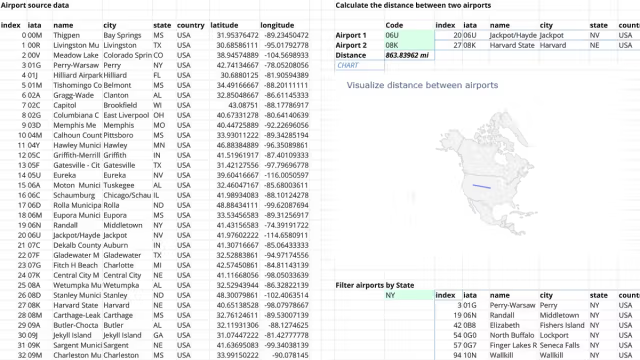
Airports distance
Calculate the distance between two airports using Python in the spreadsheet.
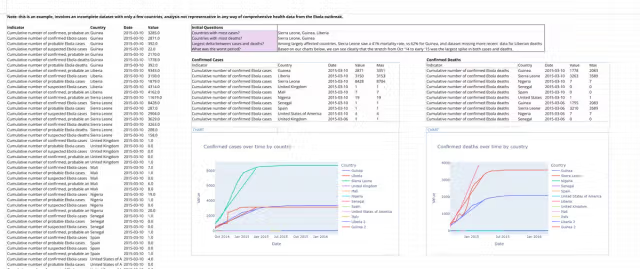
Health data exploration
Explore health data analytics using complex Pandas operations and Plotly in Python.
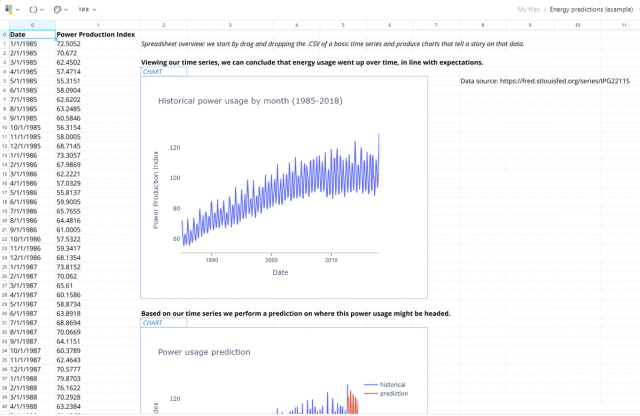
Energy predictions
Predict a country's energy usage with an ARIMA model and Plotly in Python.
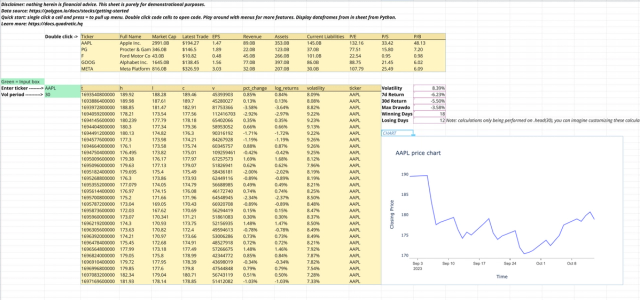
Financial analysis
Perform financial analysis on equities using Python and Formulas.
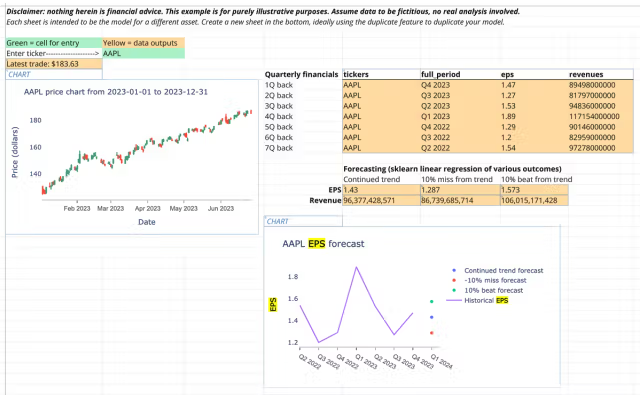
Asset research
Study a single stock with advanced analytics in Quadratic.
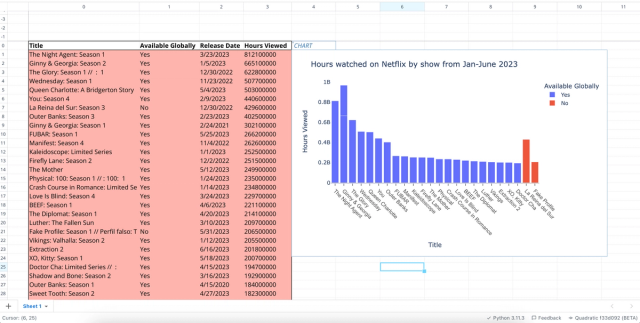
Netflix viewer data
Analyze Netflix user data, studying the hours viewed and whether or not the show is available globally.
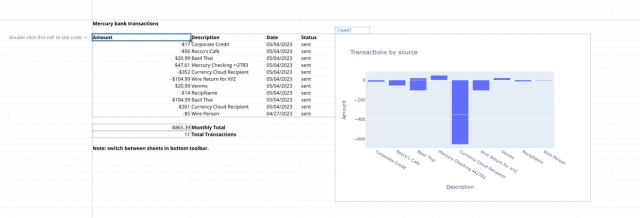
Personal finance
Manage your personal finances querying Mercury API and performing basic analytics on your spending habits.

Python intro
Get started with writing Python in Quadratic.
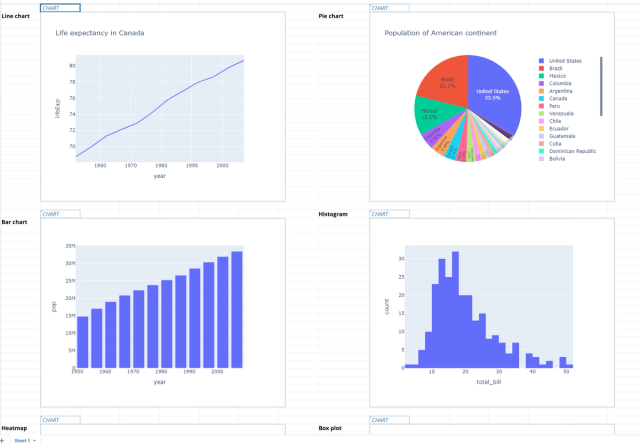
Charts intro
Get started with building Plotly charts in Quadratic.


